
Franklin County NC Housing Market: Unpacking the Spring Pending Sales Surge
By Cameron Saemann, Broker in Charge, Second Story Realty
Published July 2026
I update the Franklin County market page every morning at 6am, which means I actually watch this stuff move day to day. There are shifts that happen from time to time like inventory drifts, the median wobbles a few thousand dollars, days-on-market creeps around. But every so often a line on one of these charts does something that makes me stop and look twice.
This spring, that line was pending contracts.
The short version
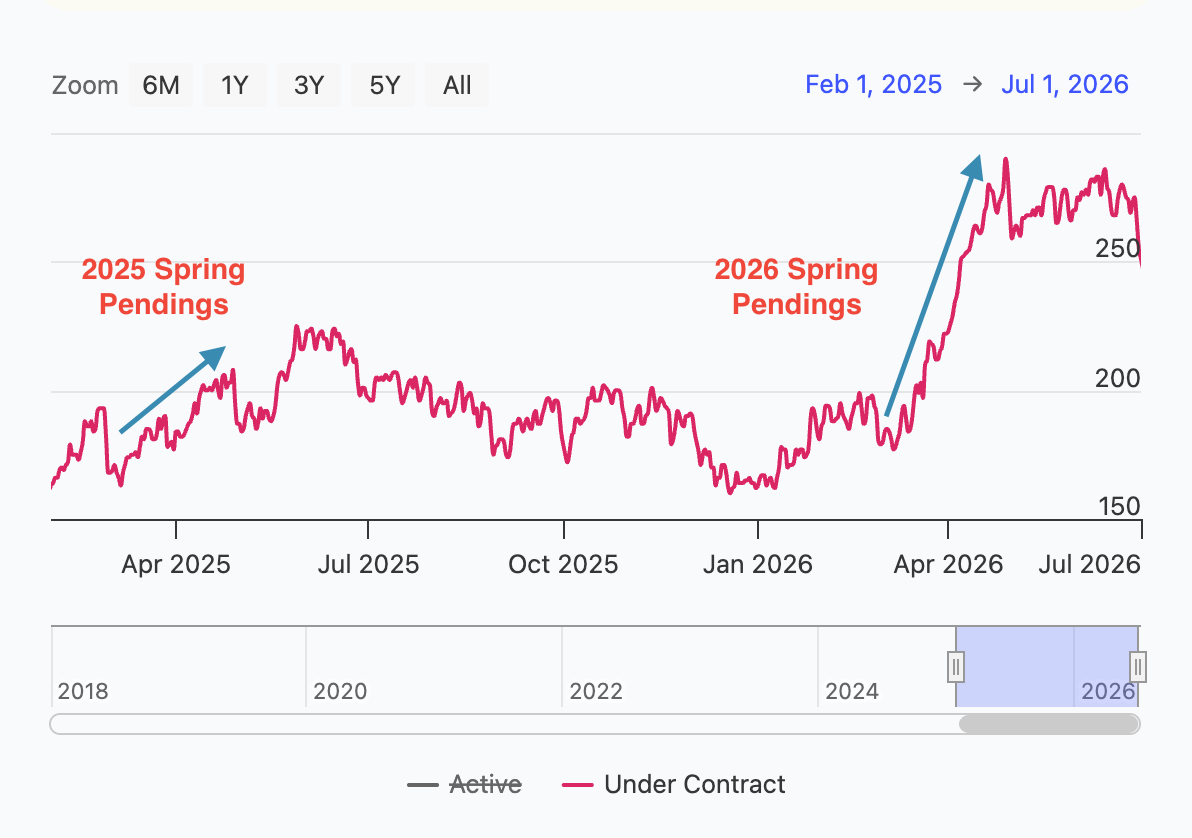
Starting the first week of March, the number of homes going under contract in Franklin County climbed steadily, and it didn’t let up until it peaked at the very end of April, hitting 290 pending contracts, up roughly 60% from where March began at 181. That’s not noise. That’s a spring buying season that showed up on time and swung hard. Here’s what it means now that we’re on the other side of it.
What the chart actually showed
Pull up the Active vs Under Contract chart on the market page and the pink under-contract line is the one to watch. Through most of the winter it sat flat. Then in early March it started climbing 181 contracts, then more the next week, then more, and it kept building right through 290.
Two things about that are worth sitting with:
1. The climb was steep, and it was early. Franklin County wakes up every spring. Buyers who browse in January and February start signing in March and April. That part is routine. What wasn’t routine was the slope, and the fact that it topped out at the end of April instead of rolling on into June the way it did in 2025.
2. Active inventory couldn’t keep pace. While pending was surging, the active (blue) line didn’t surge with it. That’s the whole story in one picture: demand accelerated faster than new supply arrived, which is exactly the setup that tightens a market and gives sellers the edge.
Was this a regional wave, or just Franklin County?
Before I tried to explain the spike, I wanted to answer one question: was this happening everywhere, or only in Franklin? If pending was surging across the whole region, that points to something big and external: rates, the broader economy, a spring the entire Triangle felt at once. If it was only us, the story is local. So I pulled the neighbors and looked.
- Vance County didn’t do it. Vance’s under-contract line went through its usual, modest spring rise (the same seasonal bump it makes most years) and nothing more. No steep climb, no outsized peak. Just a normal spring.
- Wake County didn’t do it either. Wake’s pending line this spring tracked almost exactly what it did the spring before: same low point at the start of the year, same shape, same timing on the way up. (Wake runs on a different data system with a longer history, so I’m comparing the pattern, not the raw counts, but the pattern is the point, and 2026 is nearly a copy of 2025.) For a market the size of Wake’s, “same as last year” is the tell. No anomaly.
That’s what made Franklin’s chart worth writing about. The spike wasn’t a regional tide lifting every boat. The counties on either side of us behaved exactly like themselves. Whatever drove ours was specific to this market.
What it meant if you were selling
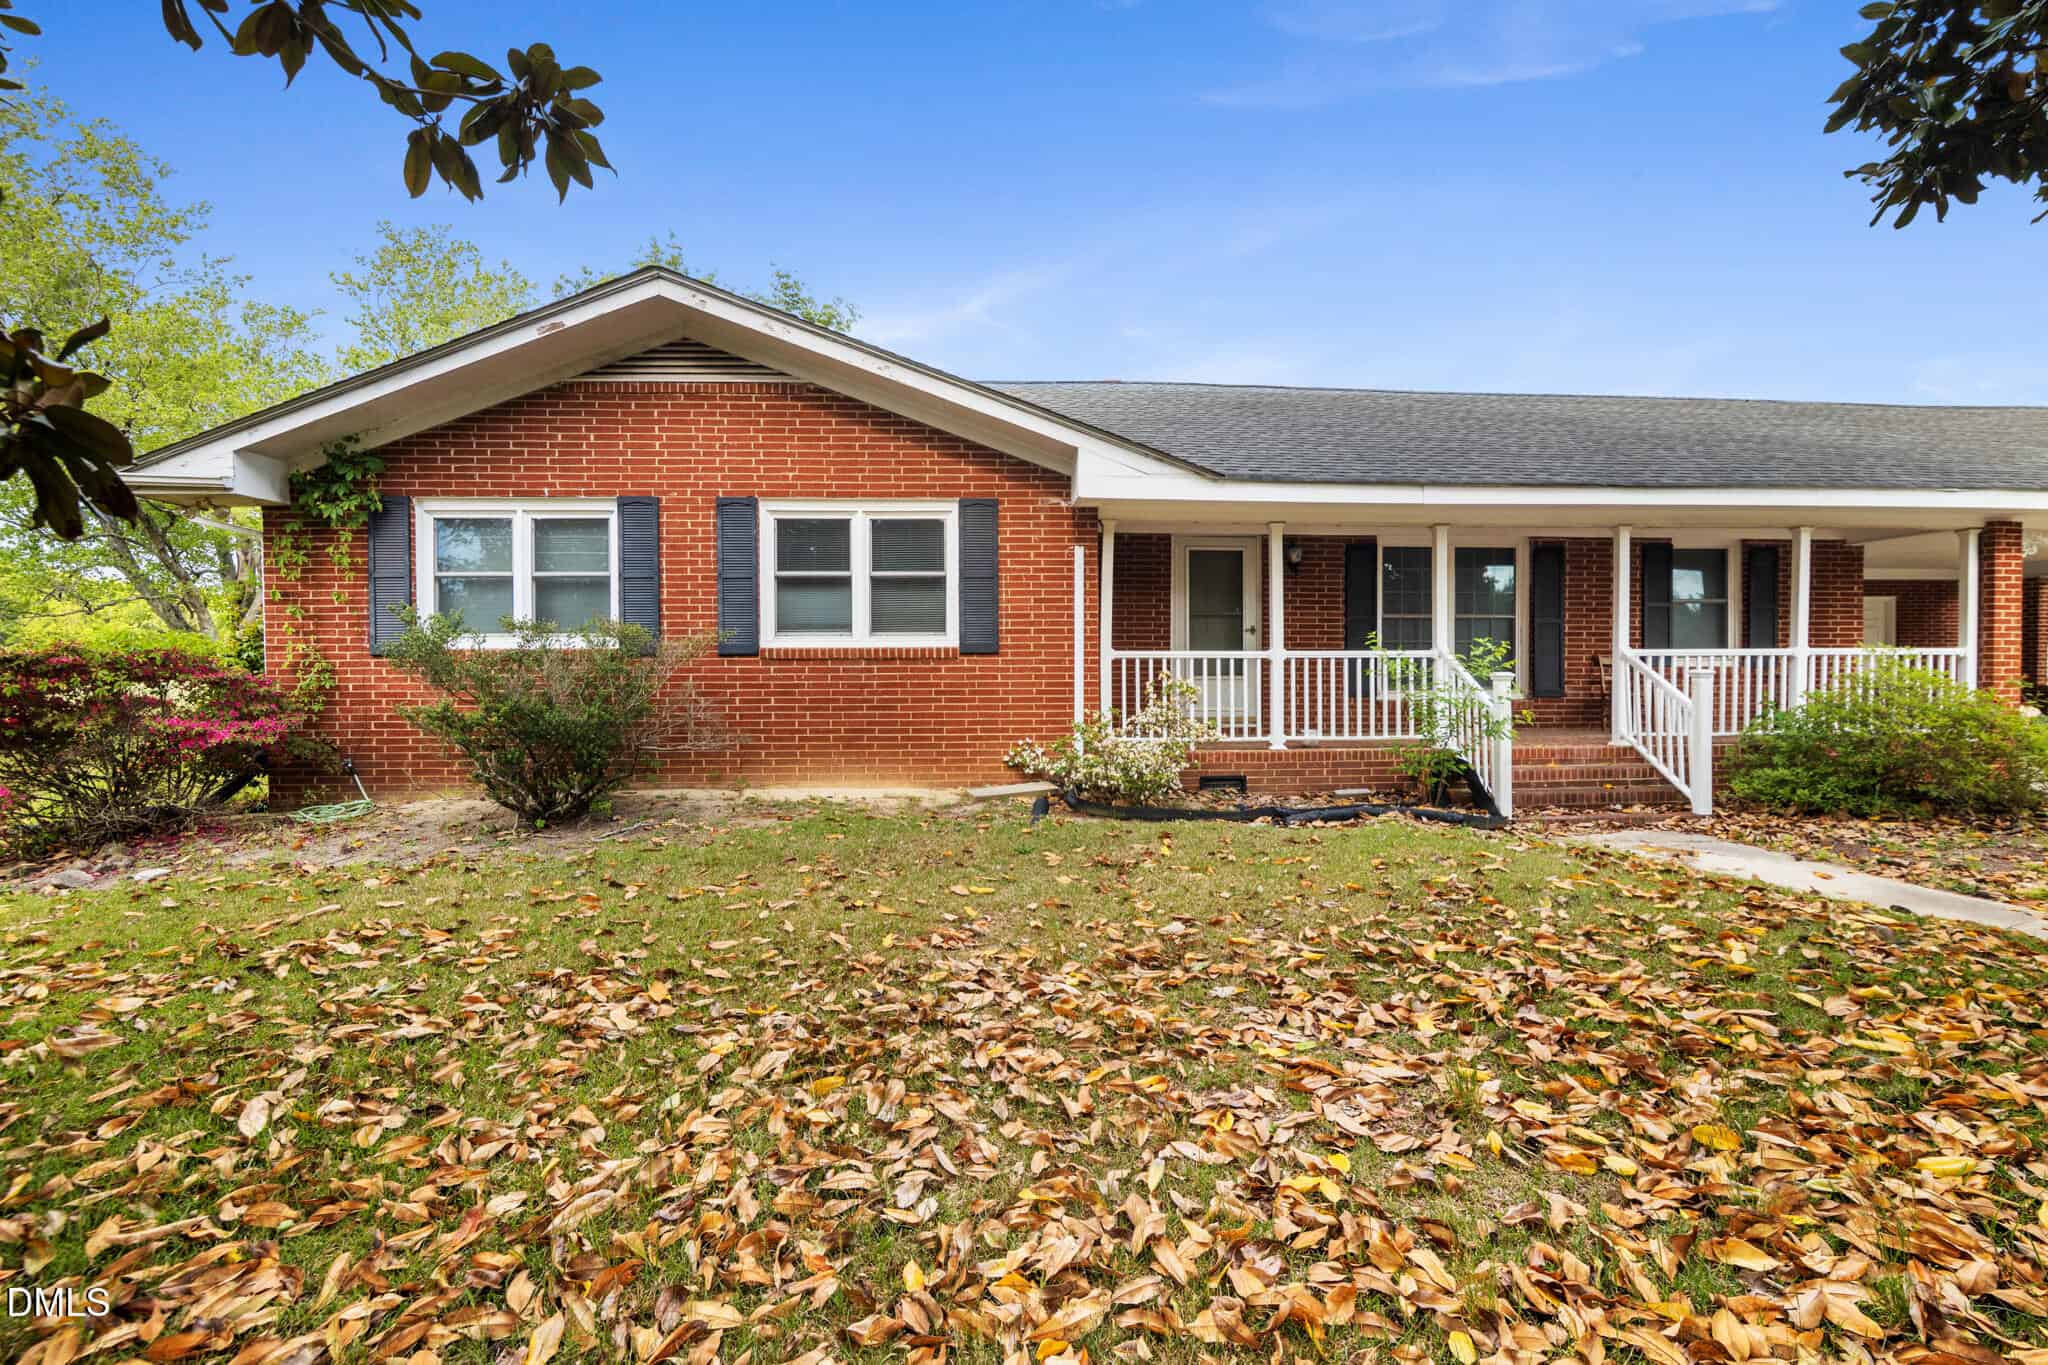
If you listed in that March–April window, you were selling into the strongest demand of the year and the numbers backed you up. The homes that moved fastest were the ones priced at the market instead of a wishful reach above it. In a surge like this, correctly-priced listings don’t just sell, they compress days-on-market and hold their price. The sellers who tested the ceiling with an aggressive number are the ones who later showed up in the price-reduction column.
What it meant if you were buying
It meant competition, plainly. When pending outruns active, you’re one of several people looking at the same house. But it also meant something buyers miss: a surge like this pulls inventory off the market, and what’s left afterward is a thinner, more picked-over selection. If you were on the fence in March, the fence got more expensive to sit on by May.
Where things stand now (early July)

The spring surge has cooled the way it always does. As of this update:
- 517 active listings against 262 pending — a pending-to-active ratio of 51%, up from 43% a year ago. Buyers are still absorbing inventory faster than they did last summer.
- 4.52 months of supply, essentially flat versus last year’s 4.36. That keeps us in balanced territory, leaning to the seller.
- Sellers are netting 97.7% of original list price, down about a point from 98.5% a year ago — a small sign that buyers have recovered a little negotiating room since the peak.
- The median sits at $385,000, down 2.5% from last month but still virtually unchanged year over year.
Translation: the spring spike did its job. It tightened the market, moved a wave of homes, and left us in a healthy, seller-leaning balance heading into summer.
Quick answers
Was spring 2026 a good time to sell in Franklin County?
Yes. March and April brought the year’s strongest buyer demand, and well-priced homes sold quickly and near ask.
Is Franklin County a buyer’s or seller’s market right now?
Balanced, leaning toward sellers. At 4.52 months of supply and a 51% pending-to-active ratio, sellers keep a modest edge.
Why do so many buyers choose Franklin County?
Affordability. Buyers priced out of Wake County get more home per dollar just up US-1 and NC-96 in Youngsville, Franklinton, and Louisburg.
Did neighboring counties see the same spring 2026 pending spike?
No. Vance County’s under-contract activity followed its normal seasonal pattern, and Wake County’s pending line closely tracked the prior year. The sharp spike was specific to Franklin County.
I’ll keep watching the lines every morning. When one of them does something worth explaining, you’ll see it here.
Thinking about your own move — either direction? The market rewards people who act on data instead of guesses. Book a 20-minute strategy call and let’s look at your specific situation.
Written by

Cameron Saemann
Broker in Charge, Second Story Realty
Broker in Charge
REALTOR®
Licensed NC Broker
Cameron founded Second Story Realty to elevate the client experience through real-time data analysis. By tracking local market metrics daily, he replaces industry guesswork with clear, strategic insights, helping clients confidently buy, sell, or wait at the right moment.
19 years guiding Triangle buyers & sellers ~ Full bio & track record →
Start Your Next Chapter Now
You deserve a real estate team that treats your largest financial asset with the precision it requires. Stop settling for guesswork and cookie-cutter processes. Whether you want to sell for maximum profit, find a home with hidden potential, or secure a fast cash offer, we have the data and the design expertise to get you there. Let’s build your custom strategy.
Market data based on information from the Doorify MLS, Inc. for the period January 2018 through July 2026. Copyright 2026 Doorify MLS, Inc. of North Carolina. All rights reserved.